

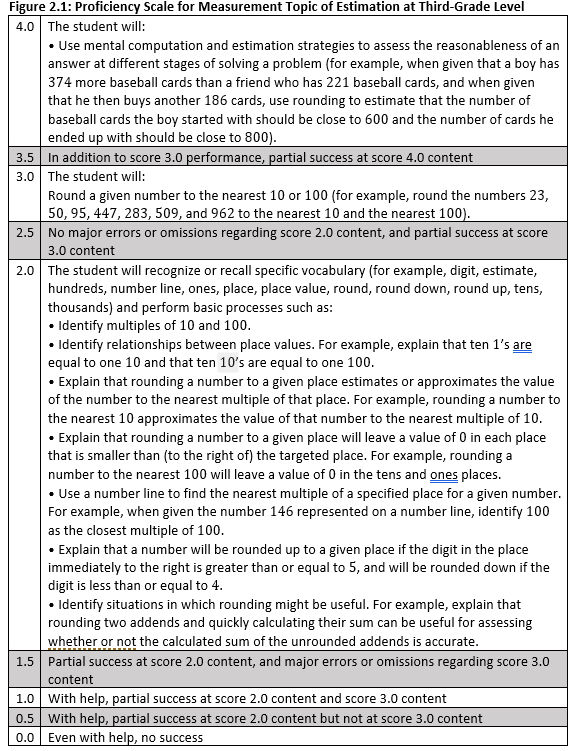
The proficiency scale is the primary tool for determining a student’s level of proficiency at any given moment. Classroom assessment should always be guided by proficiency scales since every proficiency scale has a quantitative structure that is designed for classroom assessment. To illustrate, consider the proficiency scale in figure 2.1.
Anywhere you see the icon, click it to see the proficiency scale.

The proficiency scale in figure 2.1 is for the measurement topic of estimation for third grade mathematics. The core of a proficiency scale is score 3.0 content. Score 3.0 represents proficiency. In other words, it represents what a student should know or be able to do to be considered proficient at this third grade topic. In this case, the score 3.0 content involves rounding to the nearest 10 or 100. Additionally, score 3.0 provides performance examples that would demonstrate proficiency. Score 2.0 contains necessary vocabulary terms that students will need to understand in order to reach proficiency at score 3.0. It also identifies basic skills that will be directly taught, such as identifying multiples of 10 and 100. The score 4.0 content illustrates an example of a task that could be used to demonstrate competency beyond the score 3.0 proficiency level.
These three-tiered proficiency scales are designed to make CA construction relatively easy, and they can help teachers design multiple types of assessments. This means that a proficiency scale does not limit the types of assessments teachers can design.
In addition to the explicitly stated content for a given measurement topic, proficiency scales also contain score values of 1.0 and 0.0, but these values do not contain new content. Instead, a score of 1.0 indicates that a student has some success with score 2.0 and 3.0 content with help. A score of 0.0 indicates that, even with help, a student does not demonstrate even partial success with any of the content. Student performances that represent half-point scores are also identified on the proficiency scale. The half point indicates partial achievement of the next level of the scale. For example, a score of 1.5 indicates that a student has partial competence with the score 2.0 content. (For a discussion of half-point and full-point scores, see Marzano, 2006).
In effect, the content in a proficiency scale can be translated into nine different score values based on evidence provided by a CA. This is the essence of classroom assessment within an academy. Teachers use the information provided by a specific assessment to assign students a score on a specific proficiency scale.
A number of traditional and non-traditional types of assessments can be used with proficiency scales.
Traditional Tests
Traditional tests are only one type of assessment, but they are important. Usually, traditional tests require students to write down their responses. This can be done in a paper-and-pencil format or electronically. Traditional tests are comprised of a variety of types of items and tasks, such as selected response items, short constructed response items, and extended response items.
Selected-Response Items
Many classroom tests use selected-response items and tasks. The types of items and tasks in figure 2.2 illustrate a variety of selected-response items.

Selected-response items like those in figure 2.2 are most effectively used to assess score 2.0 content. They can be used for score 3.0 and 4.0 content as well, but this requires extensive written explanation for students. For example, a teacher could construct a multiple-choice item to assess a student’s use of the decision-making process as described in score 3.0 content. However, the stem for the item would have to provide a description of the alternatives, the criteria that would be used to select among the alternatives, and the relative importance of the criteria.
Short Constructed-Response Items
While selected-response questions require students to recognize the correct answer from a set of provided options, short constructed-response items ask students to recall the answer from memory. Short constructed-response items typically require short written answers (anything from a few words to a few sentences). For example, a high school social studies test might include the short constructed-response item, “Briefly explain the role that Alice Paul played in the American women’s suffrage movement.” Short constructed-response items are usually used to address score 2.0 and 3.0 content.
Extended Constructed-Response Items
An extended constructed-response item asks students to present a longer, more complex answer to a prompt or question. An example of this type of response item is an essay. Extended constructed-response items generally assess score 3.0 or 4.0 content and often require students to draw upon multiple elements of content knowledge as they develop their answer over the course of several paragraphs. Extended constructed-response items might also pose multiple questions and prompt students to write an essay that answers all of them (see Marzano, 2010). These items often incorporate content from all three levels of the proficiency scale. Consider the following example:
Read the passage above and study the picture provided. Then answer the following questions.
A. Who is the artist this passage is about, and what medium is he or she famous for?
B. In what country and during what time period was this artist working?
C. What were the unique elements of the artist’s work, and how did people initially react?
D. Compare this artist’s work to one of the other artists we have studied. Who do you think is the superior artist and why?
This task is designed to address score 2.0, 3.0, and 4.0 content on a proficiency scale for art. Score 2.0 focuses on expressing details about an artist’s life and work, score 3.0 content focuses on understanding the unique features of an artist’s style, and score 4.0 content focuses on comparing the work of different artists.

Assessments in Empower
Creating and delivering assessments via Empower has several advantages.
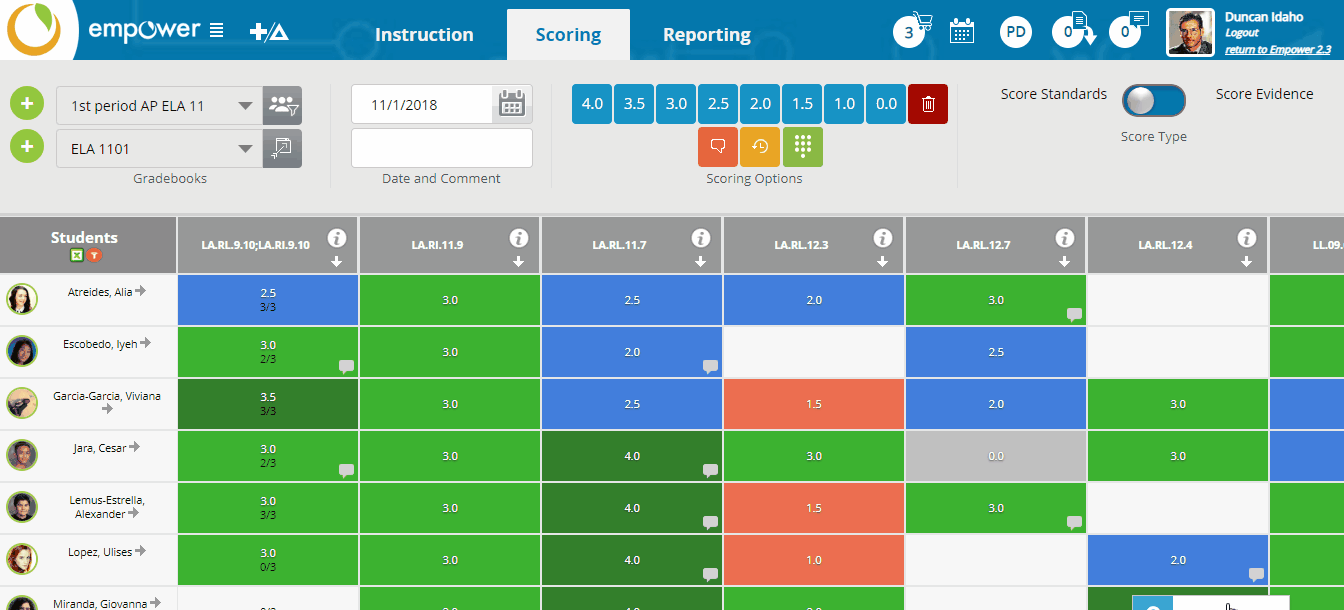
Objective-type questions (true/false, fill-in-the-blank, multiple choice, etc.) can be scored by the system. Scores will automatically be entered into appropriate gradebooks and the student's portfolio.
As with all created instruction in Empower, assessments can be co-created, shared and re-used district-wide and year after year.
Each question needs to be aligned to one and only one measurement topic and a proficiency scale level must also be chosen to ensure score reliability.
Learn all about assessments in Empower in this tutorial:
Non-Traditional Assessments
While teachers in an academy will certainly use traditional tests, they will more commonly use non-traditional assessments.
Probing Discussions
A probing discussion is a type of oral assessment. This means that a teacher meets one-on-one with a student to talk about a specific topic. The teacher begins with a broad prompt, then, as the student explains the relevant concepts, the teacher asks more specific or in-depth questions to determine what the student knows and does not know about the topic. The proficiency scale is used as a guide for questioning. In other words, the teacher determines a student’s score by asking questions that correspond to the levels of the scale.
Evidence from probing discussions can be directly translated into a score on a proficiency scale. This means that there is no need to assign a format-specific score and then translate that score into a proficiency scale score. For example, during a probing discussion with a student working on the fifth-grade science topic of ecosystems, a teacher would ask questions pertinent to score 2.0, 3.0, and 4.0 content on the proficiency scale for that topic. At the end of the discussion, the teacher might conclude that the student demonstrated a thorough understanding of the score 2.0 content, a thorough understanding of the score 3.0 content, and a partial understanding of score 4.0 content. The teacher would then assign the student a proficiency scale score of 3.5 for that assessment.
Demonstrations
Demonstrations are assessments that ask students to perform a skill or complete a strategy or process. For example, a social studies teacher might ask a student to demonstrate how to use the key on a map to interpret a particular map feature. Demonstrations can be used to assess both physical and mental skills and procedures. In the case of mental skills, the teacher can ask the student to explain the process as he or she performs it. Demonstrations can also be scored directly from a proficiency scale. For example, a student working on a fifth-grade English language arts measurement topic on using citations has prepared a demonstration of the process. As the student executes and explains the steps, the teacher might realize that he has demonstrated all the score 2.0 content correctly and has also demonstrated some of the 3.0 content. The teacher would then assign a score of 2.5.
Observations
The assessment formats discussed thus far are all forms of obtrusive assessments (meaning that they interrupt the normal flow of classroom activity). Observations however, are often unobtrusive—meaning the student may not be aware that he or she is being assessed. Observations involve the teacher noticing a student demonstrating some level of proficiency and recording a score as a result. Skills, strategies, and processes are most often the subject of observations. For example, a science teacher might notice a student independently executing the correct procedures for a specific aspect of a research project.
Informational knowledge can also be the subject of an observation. For example, a student might use a vocabulary term in a class discussion that represents score 2.0 content on a scale. The teacher would recognize that the student understands that content. Again, observations are scored directly from a proficiency scale.
Entering Quick Evidence
Anytime, anywhere that learning happens, Empower allows you to capture it as evidence. In some of the above cases, best practice would be to enter student scores into Empower's gradebook as Quick Evidence. This is a simple way to quickly capture observations and non-digital evidence.
Student-Generated Assessments
Student-generated assessments allow students to decide how they will demonstrate proficiency. This process allows students to take responsibility for demonstrating their learning. When a student feels that she has achieved a particular level of proficiency, she goes to the teacher and explains how she is going to demonstrate her knowledge or skill. Students commonly use such assessments to demonstrate competence at a specific level of a scale. For example, a student might propose that she will make a timeline of civil war events to show her understanding of that topic at the 2.0 level on a proficiency scale.
Students can create their own evidence (activities) in Empower and select a teacher who will score it.
Quick Group Assessments
As the name implies, quick group assessments are administered to the entire class. They are usually focused on score 2.0 content that can be assessed easily with selected-response items. For example, assume that a particular science proficiency scale on the topic of energy conversion has the following elements at the score 2.0 level.
1. Explain that an object’s energy is a combination of kinetic energy and potential energy.
2. Use the law of conservation of energy to explain why energy is always transferred from place to place or from form to form.
3. Describe various forms of energy (for example, chemical, elastic, electrical, light, mechanical, nuclear, sound, thermal).
The teacher might consider selected-response items like the following:
1. Fill in the blanks: An object’s energy is a combination of ________________ energy and
__________________ energy.
2. Select the best answer. The law of conservation of energy says that:
A. Energy is constant in a closed system.
B. Energy can change form, but it can’t be created or destroyed.
C. Both A and B.
D. Neither A nor B.
3. Select any items in this list that are not forms of energy: chemical, sound, electrical, practical, heat, weight.
Each of these items would be displayed to all students simultaneously, perhaps using a PowerPoint slide. Students could record responses in a variety of ways. For example, they might hold up response cards. The teacher could then record responses as the assessment progresses. By the end of the class, the teacher would have scores for each student on a multi-item assessment of score 2.0 content. An easier way might be to use electronic voting devices (or “clickers”.) If teachers have devices that allow students to connect to the Internet, they can also use free sites or software to gather students’ responses. Of course, an Empower assessment can also be used. This gives the added advantage of being automatically scored and entered into the gradebook for easy review.
Student Self-Assessments
Student self-assessments are distinct from student-generated assessments. With student-generated assessments, a student proposes a task he or she will perform to demonstrate competency at a certain level of a proficiency scale. With student self-assessment, students score themselves using personal tracking matrices, and these student-generated scores are translated into proficiency scale scores by the teacher. To illustrate, consider the personal tracking matrix in figure 2.3.

This personal tracking matrix for the topic of solving linear equations through graphing is depicted in figure 2.3. The matrix was created by unpacking the elements of the proficiency scale for this topic into discrete score 2.0 elements. Elements such as vocabulary were assigned a row in the matrix. Each row explicitly states its level on the proficiency scale. Finally, there is a self-rating scale ranging from, “I’m still confused about this topic” to, “I’ve got this now” in each row.
Note that the student in figure 2.3 has assigned himself the value of “I’ve got this now” for all the score 2.0 content. The student has assigned the value of “I’ve learned some but not all of the topic” for the score 3.0 element and has assigned himself the value of “I’m still confused about this topic” for the score 4.0 content. In the column titled “My Evidence” the student has briefly noted the activities and assignments he completed as support for his self-ratings.
Note that for the teacher to use the matrix as an assessment, the student would have to provide more evidence for the score he assigned. This evidence could come in the form of a physical or electronic folder the student keeps with related assignments and assessments. The teacher would examine the student’s self-assessment represented in the personal tracking matrix as well as the supporting evidence. This evidence would allow a teacher to create a score on the proficiency scale. Analysis of the personal tracking matrix will generally be accompanied by a brief conversation with the student. While interacting with the student, the teacher might glean more information and decide that the student’s self-assessment warrants a different score on the scale.
Scoring Assessments
Most types of assessments can be scored in such a way that they are immediately translated into a score on the proficiency scale. However, some assessments, like traditional tests, are first scored in a way that best fits their format and then translated into a score on the proficiency scale. To illustrate, consider the percentage method of screening traditional tests.
Using Percentage Scores
This method involves determining what percentage of available points a student earned and using that percentage to assign an appropriate proficiency scale score. To illustrate, consider figure 2.4.

Figure 2.4 compares the available points on each section of an assessment to the points that a student earned. For example, there were twenty-five points available in the score 2.0 section, and this student earned twenty-two. This ratio is then converted into a percentage to make it easier to assess the student’s overall success in each section. The teacher examines the percentage for each section to determine a proficiency scale score. In figure 2.4, the student earned 88 percent in the score 2.0 section, indicating that he or she knows most of that content. The student also earned 50 percent in the score 3.0 section, indicating that he or she knows half of that content. Based on this evidence, the teacher would likely assign a proficiency scale score of 2.5, meaning there were no major errors or omissions with the basic content and there was partial success with the 3.0 content.
Using Response Codes
When using response codes, the teacher marks a student’s responses to each item correct, partially correct, or incorrect and then examines the pattern of responses to determine the student’s level of proficiency. To illustrate, consider figure 2.5.

This student provided all correct responses for the score 2.0 items, so the overall pattern for the section is recorded as correct. In the score 3.0 section, he or she gave one correct answer and two partially correct answers, leading to a section pattern of partially correct. Both items in the score 4.0 section were marked incorrect, so the overall pattern for that section is incorrect. Because these patterns indicate complete understanding of score 2.0 and partial understanding of score 3.0, this student would receive an overall score of 2.5.
Proficiency Scales with Multiple Elements
One issue that commonly arises when assessments are designed using proficiency scales, involves scales that have more than one element at the score 3.0 level. This is depicted in figure 2.6.

When a proficiency scale has more than one element at the score 3.0 level, not every element must be represented on every assessment given. More than one element are included on a scale when it can be assured that the elements covary.
Here we use the term covary to mean that sets of knowledge and skill in the element are related in such a way that as you get better at one component, you quite naturally get better at the others. When elements on a scale covary, it can be considered unidimensional for the purposes of measurement. Figure 2.6 above depicts this situation. That proficiency scale has three statements at the score 3.0 level that might even have come from different standards statements. However, the educators who created the scale believed that these three components could be taught in such a way that student improvement in one component would naturally stimulate student improvement in the other elements.
Note the italicized phrase “could be taught in such a way.” Whether or not content truly covaries and can, therefore, be considered unidimensional, can depend on how the content is taught. For example, consider the score 3.0 elements in figure 2.6:
-
Convert numbers in decimal form to simple fractions
-
Convert fractions to numbers in decimal form using division skills.
-
Convert fractions and numbers in decimal form to percentages.
There is obviously some overlap in these statements. While a case could be made that each of these elements should be taught as separate measurement topics and, therefore, should have their own proficiency scales, just as strong a case can be made that they can be taught in a highly integrated fashion. If this is accomplished, then the statements should be in a single proficiency scale. Assessments designed using such a proficiency scale would, therefore, address these three statements as a single entity. Not every assessment would have to contain content from each of the statements though. A pretest and post test constructed from this scale would probably address all three elements equally, but the assessments in between would vary in their emphasis.
All Scores Are Proficiency Scale Scores
It is important to remember that all assessment scores should be recorded as proficiency scale scores. For example, as depicted in figure 2.6, a teacher might administer an assessment with three sections that pertain to score levels 2.0, 3.0, and 4.0 on a proficiency scale. Each of its own sections might have its own score, but teachers do not record them (meaning the teacher does not need to record three scores). Instead, the teacher examines the score pattern across the three sections to assign an overall proficiency scale score for the assessment. It is this one proficiency scale score that is recorded, not the format-specific scores. To use another example, a teacher might administer a ten-point quiz on score 2.0 content. Teachers might score this quiz using a percent-correct method. Any student scoring 80 percent or higher would receive a score 2.0 on the scale, and the teacher would record only the score 2.0.
Multiple Proficiency Scale Scores
For every measurement topic academy teachers will develop and administer multiple assessments using the proficiency scale as the guide for designing these assessments. Academy teachers might design common pre-assessments and post-assessments for each measurement topic, but this is not a requirement. However, it is a requirement that academy teachers provide multiple proficiency scale scores for each student in each measurement topic. Ideally, teachers enter at least three proficiency scale scores for each student on each measurement topic.
These multiple scores are entered as “evidence scores” with the Empower system. Each time a teacher generates a score for a student it is entered into the Empower system for that particular student. During a single class period a teacher might enter a score for a particular measurement topic for a specific student when the teacher had observed functioning at the score 2.0 level. During the same class period the teacher might have a probing discussion with another student regarding another measurement topic and enter that score into Empower for that student on that topic. This, of course, differs greatly from the traditional approach of giving a single assessment to all students during a specific class period, scoring the assessment for each student and then entering the scores for all students into a gradebook. While this convention can still be used, academy teachers more commonly enter proficiency scale scores for small sets of students regarding a variety of measurement topics almost every day. This renders record-keeping for an academy broadly diffused throughout the school year and much more a part of the day-to-day interaction in the classroom.
Keeping track of proficiency scale scores requires no more record-keeping than any other system. For example, assume that a particular level or grade level contains twenty proficiency scales. Teachers generate multiple proficiency scales for each student. Over the course of the year, the teachers generate three to five scores for each student on each measurement topic. If we assume an average of four scores per measurement topic, this amounts to eighty scores for each student over the course of the year. If we assume an average of six scores per measurement topic, this amounts to 120 scores for each student over the course of a year.
This is roughly the same number of scores per student typically recorded in a traditional system. In a traditional system, a teacher records quizzes, formal tests, homework, various assignments, and extra credit points for a single student each quarter. If a quiz is given every week, homework or assignments are recorded twice a week, and a test is given halfway through the quarter and at the end of the quarter, then the teacher would record twenty-nine scores (nine quizzes, eighteen homework assignments, and two tests) per student per quarter. This would mean 116 entries each year per student.
Generating Summative Scores
Academy teachers assign summative scores in specific ways quite unlike teachers in a traditional classroom. The traditional approach is to administer a single test referred to as the summative assessment. If students receive a score on that test that is equal to or greater than a specific “cut score” on the summative test, they are considered to be proficient. This approach is fraught with many problems, not the least of which is that it can be highly inaccurate (see Marzano, 2018).
In an academy teachers assign summative scores based on the pattern of scores that have been assigned to students over the various assessments described previously. For a specific measurement topic, students would have different numbers of proficiency scale scores, assigned using different types of assessments at different times. This is depicted in figure 2.7.

As described above students do not have the same number of scores. Scott has five, Meara has three, and Justin has four. Students can be assessed at different times, with different types of assessments, and with different frequencies. However, teachers use these scores to construct a reliable summative score. To illustrate, consider figure 2.8.

Figure 2.8 depicts a single student’s scores on a specific measurement topic. The bars represent six proficiency scale scores that were assigned over time. Such scores are referred to as observed scores. The student began with an observed score of 1.5 and ended with a score of 4.0. As these scores are entered into the Empower system, it will automatically compute three estimates of the best summative score and mathematically evaluate which is best. The three ways of computing a summative score are also illustrated in figure 2.8: linear, curvilinear, and average. If the average were used to compute the student’s summative score, it would be 2.5. The average would only make sense as a summative score if the student demonstrated no learning from one assessment to the next. If a teacher used the linear trend in the student’s scores, the summative score would be 3.66. The linear trend score makes sense if the student’s learning increases at the same rate as time goes on. Finally, a teacher can use what is referred to as a curvilinear trend. If a teacher used this model, the summative score would be 3.14. The curvilinear trend makes sense if the student’s learning increases quickly in the beginning and then flattens out as the student reaches proficiency.
Perhaps the most powerful aspect of the Empower system is that it mathematically evaluates each of the three trends in terms of how well they represent, or fit, the observed scores (Marzano, 2006). In this case, the Empower system would determine that the linear trend best fits the observed scores. This means that 3.66 would be the best mathematical estimate of the student’s summative score.
Academy teachers use this information to assign a summative score. It is important to note that an academy teacher can use the exact mathematical summative score computed by Empower. In this case the score would be 3.66. However, in some academies, the convention is to round the mathematically computed summative score to the nearest half point. In this case, that would be 3.5.
Summative Decisions
The Marzano True Score Calculator is a powerful tool in Empower which gives teachers a wholistic look at a learner's historical evidence and progress through a given measurement topic according to the philosophy laid out above.
From the Summative Gradebook (Score Standards), it is only a click away.
Learn more about summative scoring in this tutorial video:
Further Resources

Tutorial Videos
Print Resources
Personalized Competency Glossary
One Sheet: Score Quizzes
One Sheet: Marzano True Score Estimator